Pengfei Han [1]
Overview
To comprehensively and accurately assess the relations between China and the United States in the technology sector, it is essential to distinguish between the concepts of "decoupling" and "dependence". In this report, "decoupling" refers to the incompatibility of technological development paradigms between different technological systems due to varying technical standards, independent of a country's technological strength. Conversely, "dependence" is closely linked to a country's technological strength: the weaker a country's technological capabilities, the greater its reliance on foreign technology. Therefore, this report develops two distinct measures for "decoupling" and "dependence" within a unified framework.
In the 21st century, the dynamics of U.S.-China technology "decoupling" and "dependence" have exhibited divergent trends. Since China's accession to the World Trade Organization (WTO), the overall measure of decoupling between the two countries has gradually decreased, while China's dependence on U.S. technology has followed an inverted U-shaped trajectory—initially increasing and then decreasing, with the turning point occurring at the end of the global economic recession. This inverted U-shaped trend is largely attributable to the knowledge and technology spillover effects between multinational corporations and Chinese enterprises.
The degree of technology decoupling and dependence between China and the U.S. varies significantly across different technological fields. In mature fields, such as internal combustion engine technology, decoupling between China and the U.S. remains relatively low, while China's dependence on U.S. technology is relatively high. In emerging fields, such as drone technology, decoupling is relatively high, whereas China's dependence on U.S. technology is relatively low. In high-tech sectors, U.S.-China technology decoupling has intensified in recent years, accompanied by a decrease in China's reliance on U.S. technology. Notably, in certain fields like drone technology, China has achieved reverse dominance, where the U.S. now depends more on Chinese technology than China does on U.S. technology.
Given the heterogeneity in technology decoupling and dependence across different fields, China's industrial policy should be tailored to different technological areas rather than taking a one-size-fits-all approach. Policies should be differentiated based on the distinct characteristics of emerging and mature technologies to maximize their effectiveness.
As the inaugural issue of the "U.S.-China Technology Decoupling" series report, this policy brief is structured as follows: The first section reviews the significant changes in the global innovation landscape since the millennium. The second section details the construction of a measurement system for U.S.-China technology decoupling. The third section analyses the U.S.-China relationship in the technology sector in recent years based on this measurement system. The Fourth section examines the heterogeneity of U.S.-China decoupling across different technical areas. Finally, the last section provides policy recommendations derived from these findings.
I. Changes in the International Landscape of Innovation in the 21st Century
Since the start of the 21st century, the global innovation landscape has undergone profound and dramatic changes. On one hand, the United States has maintained its position as the world's leading innovative power, although its lead is gradually narrowing. On the other hand, with China's transition from "Made in China" to "Created in China," China has rapidly emerged as a global innovator with substantial international influence. This dynamic shift is changing shares of research and development (R&D) investment between the U.S. and China.
Figure 1 below illustrates the changes in international influence in terms of innovation between the U.S. and China. The vertical axis represents the share of global R&D investment by the two countries.[2] In 2000, the U.S. accounted for 36.4% of global R&D investment, while China accounted for only 4.5%. However, since joining the World Trade Organization (WTO), China's R&D investment has maintained an annual growth rate of over 10%, significantly higher than that of the U.S. As a result, China’s share of global R&R investment surged from 4.5% in 2000 to 23.3% in 2017, while the U.S. share declined from 36.4% to 25.6% during this period. In recent years, China's R&D investment as a percentage of GDP has reached approximately 2.2%, a level comparable to the average among EU member states.
China has accounted for about one-third of global R&D investment growth during this period. Similarly, the U.S. and the EU have each contributed about one-third of global R&D growth, while Japan and South Korea have each contributed approximately 10% of the growth.
In 2010, China became the world’s top manufacturing nation, ending the U.S.’s 110-year dominance. Subsequently, China became the largest trading nation in goods in 2013 and the largest economy by purchasing power parity (PPP) in 2014. Another milestone was reached in 2019 when China filed the largest number of international patent applications with the World Intellectual Property Organization.
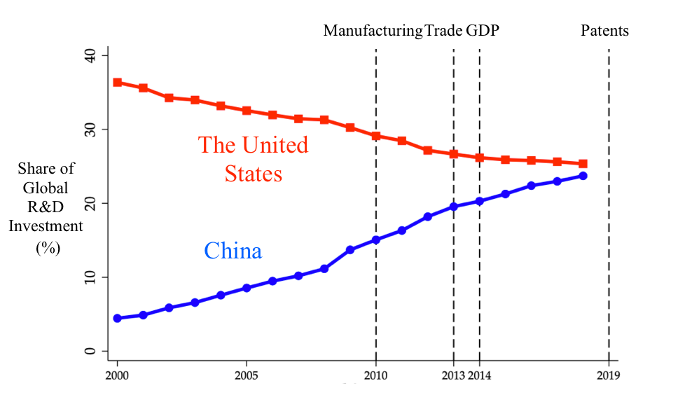
Figure 1. Share of Global R&D Investment by the U.S. and China (in PPP)
China’s technological progress has benefited from its integration with the developed world and the resulting knowledge spillover. Science and technology flow more freely across national borders than goods or human capital. Internet protocols, hardware design and manufacturing, software development and deployment, and information technology services and standards have all, to varying degrees, evolved within a global system. However, recent years have seen signs of "de-globalization" within the global technological framework. In particular, changes in the international geopolitical landscape have led to intensified U.S. sanctions against China, indicating a potential divergence between the two countries' technological systems—commonly referred to as "decoupling." Faced with the severe challenge of an increasing number of Chinese enterprises (such as Huawei) and universities (such as Harbin Institute of Technology) being sanctioned by the U.S. and added to the "Entity List," China urgently requires an objective and accurate assessment of the development trends and impacts of U.S.-China technology decoupling. To this end, we have linked patent data from China and the U.S. to construct an empirical measure of the degree of decoupling in the technology sector between the two countries in Figure 1.
II. Construction of a Measurement System for U.S.-China Technology Decoupling
Similar to academic papers, patents also cite one another, and citation information is extensively used to study knowledge spillovers between different countries and regions. To accurately measure the degree of technology decoupling between China and the U.S., we have linked patent data from both countries and employed an orthogonal decomposition of mutual citation tendencies to construct a measurement system for U.S.-China technology decoupling.
Specifically, to comprehensively and accurately depict the technological relations between China and the U.S., it is essential to distinguish between the concepts of "decoupling" and "dependence" in the technology sector. In this article, "decoupling" refers to the incompatibility of technological development paradigms between different systems due to varying standards. For example, the standard voltage is 220 volts in China and 110 volts in the U.S. Thus, "decoupling" is not necessarily related to a country's technological strength. In contrast, "dependence" is closely tied to a country's technological capabilities: the weaker a country's technological strength, the higher its dependence on foreign technology. Therefore, we have developed two distinct measurements for "decoupling" and "dependence" in the technology sector within a unified analytical framework.
The core concept behind constructing this measurement system for "decoupling" and "dependence" in the technology sector can be illustrated using Figure 2. The axes in this figure represent the tendency of domestic patents to cite foreign patents relative to citing domestic patents. The vertical axis represents the tendency of Chinese patents to cite U.S. patents relative to citing Chinese patents, while the horizontal axis represents the tendency of U.S. patents to cite Chinese patents relative to citing U.S. patents. In the extreme case of "complete decoupling" of the U.S.-China technological systems, the technological trajectories of the two countries would be entirely independent, with no mutual citations between patents from the two countries. This scenario corresponds to the origin (0, 0) in Figure 2. Conversely, in the extreme case of "complete integration" of the U.S.-China technological systems, the tendency of domestic patents to cite foreign patents would be equal to the tendency to cite domestic patents. This corresponds to point I (1, 1) in Figure 2.
Each point in Figure 2 represents a specific dependency relationship between China and the U.S. Along the 45-degree line, the mutual citation tendencies of patents from the two countries are equal, indicating a state of equal mutual dependence. In the region above the 45-degree line, the tendency of Chinese patents to cite U.S. patents is higher than the tendency of U.S. patents to cite Chinese patents, indicating that China's dependence on U.S. technology is higher than the U.S.'s dependence on Chinese technology. This region can be termed the "U.S.-leading" region. The degree of U.S. leadership reaches its maximum at point (0, 1), which can be termed the "U.S.-dominated" state. Conversely, in the region below the 45-degree line, the tendency of Chinese patents to cite U.S. patents is lower than the tendency of U.S. patents to cite Chinese patents, indicating that China's dependence on U.S. technology is lower than the U.S.'s dependence on Chinese technology. This region can be termed the "China-leading" region. The degree of Chinese leadership reaches its maximum at point (1, 0), which can be termed the "China-dominated" state.
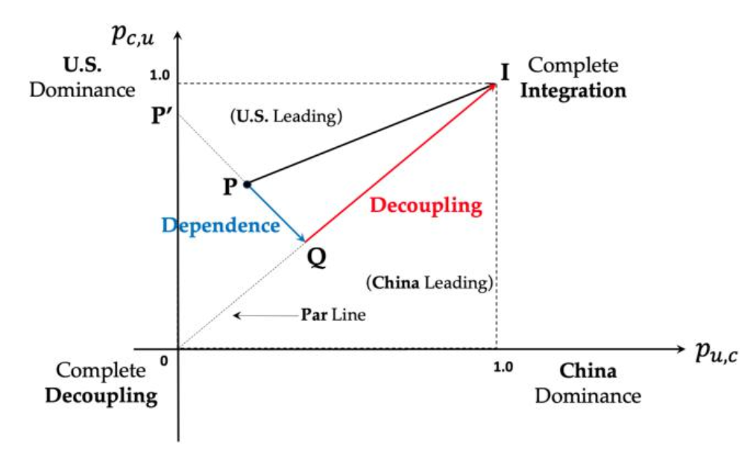
Figure 2. Measures of Technology Decoupling and Dependence
Therefore, each point in Figure 2 represents a specific combination of two indicators: (1) the degree of U.S.-China technology decoupling (indicated by the red "decoupling" label) and (2) China's relative dependence on U.S. technology (indicated by the blue "dependence" label). Specifically, we can project each point (such as point P) in Figure 2 onto the 45-degree line. Along this line, the level of mutual dependence between China and the U.S. is always equal, but the degree of decoupling varies, ranging from "complete decoupling" at the origin to "complete integration" at point I. Therefore, the vector QI (the projection of vector PI onto the 45-degree line) represents the degree of U.S.-China technology decoupling. When a point deviates from the 45-degree line, the relationship between the two countries becomes asymmetrical, meaning one country depends more on the other. The extent of this deviation illustrates the "net" dependence of one country on the other. For instance, at point P, the vector PQ (the orthogonal projection of vector PI onto the 45-degree line) represents China's relative dependence on U.S. technology. The greater the deviation of point P from the 45-degree line, the longer the vector PQ, and the higher China's relative dependence on U.S. technology. Thus, we can project each point in Figure 2 onto the 45-degree line to measure the degree of U.S.-China technology decoupling via vector QI and the relative dependence via vector PQ.
III. U.S.-China Relations in the 21st Century Technological Sector
Based on the measurement system constructed above, we first examine the critical turning points in U.S.-China technological relations in the 21st century, as depicted in Figure 3. Similar to Figure 2, the axes in Figure 3 represent the tendency of domestic patents to cite foreign patents relative to citing domestic patents. Specifically, the vertical axis in Figure 3 indicates the tendency of Chinese patents to cite U.S. patents relative to citing Chinese patents, while the horizontal axis represents the tendency of U.S. patents to cite Chinese patents relative to citing U.S. patents. Using actual patent data, Figure 3 highlights the key turning points in U.S.-China technological relations in the 21st century: 2000 (the year before China joined the WTO), 2009 (the end of the global financial crisis), and 2021 (a year significantly impacted by the COVID-19 pandemic).
The data illustrated in Figure 3 reveal two major trends in U.S.-China technological relations since 2000:
First, overall, the data points in Figure 3 shift northeast from being near the extreme of complete decoupling (the origin) toward a higher degree of integration between the two countries. This indicates that the overarching trend in U.S.-China technological systems development in the 21st century is toward mutual integration.
Second, since China's accession to the WTO, the data points in Figure 3 initially move northeast and away from the 45-degree line, then shift southeast and closer to the 45-degree line after the global financial crisis. This suggests that China's dependence on U.S. technology increased after joining the WTO but gradually decreased following the global financial crisis.
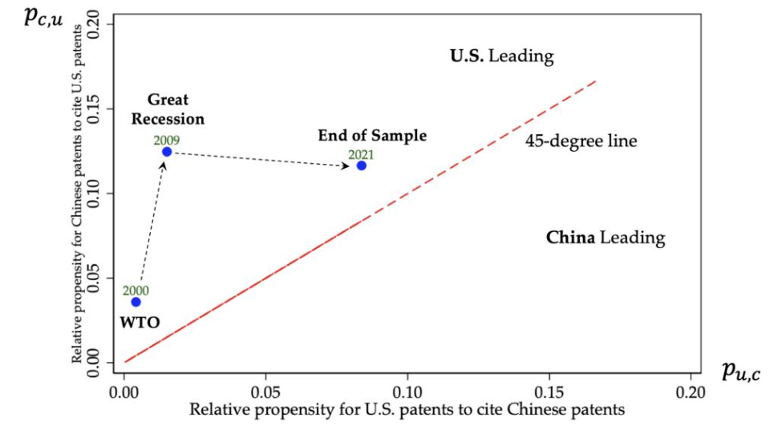
Figure 3. U.S.-China Technology Decoupling and Dependence in 2000, 2009, and 2021
Building on this measurement system of technology decoupling and dependence, Figure 4 offers a more detailed depiction of U.S.-China technological relations since 2000.
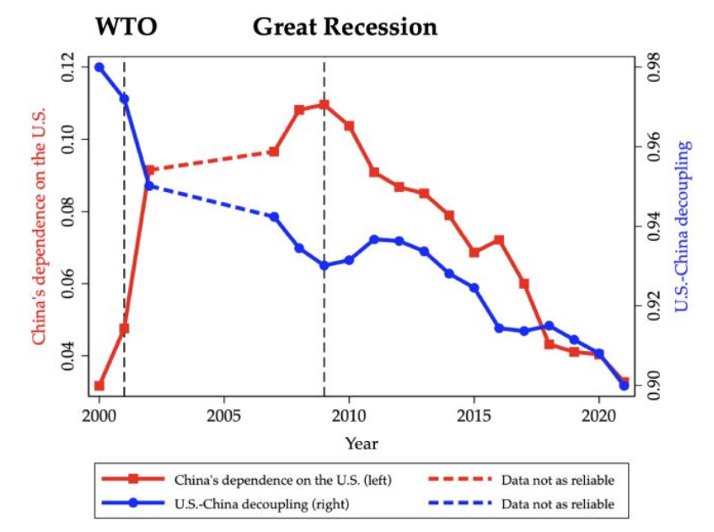
Figure 4. U.S.-China Technology Decoupling and Dependence, 2000-2021
The blue "decoupling" line in Figure 4 indicates that since China joined the WTO, the overall trend in U.S.-China decoupling has gradually decreased. Following China's entry into the WTO, there has been rapid growth in trade, investment, and talent mobility between the U.S. and China, all of which have facilitated the integration of China's technological system with those of developed countries, thereby promoting the mutual integration of U.S.-China technological systems. Since the inception of China's reform and opening-up policy in 1978, nearly 5 million Chinese students have studied abroad, with about 4.2 million returning to China after completing their studies; Chinese students make up about 35% of the total international student population in the U.S., the highest proportion of any country.
The red "dependence" line in Figure 4 suggests that since China joined the WTO, China's dependence on U.S. technology has followed an inverted U-shaped trajectory, initially increasing and then decreasing, with the turning point coinciding with the end of the global financial crisis. This trend reveals that although the overarching direction of U.S.-China technological system development has been toward mutual integration, the nature of this integration has fundamentally changed: before the global financial crisis, the integration process was characterized by deepening dependence; after the crisis, it shifted toward growing independence.
One significant reason for the inverted U-shaped shift in China's dependence on U.S. technology is the knowledge and technology spillover effects between multinational corporations in China and Chinese enterprises. After China acceded to the WTO, multinational corporations significantly increased their presence in the Chinese market. While this created substantial competitive pressure for Chinese businesses, it also provided them with valuable opportunities to learn from leading international corporations. By acting as subcontractors and suppliers for these multinational firms, Chinese businesses gradually absorbed the expertise of leading global companies, thereby increasing their dependence on foreign technology. However, through learning their advanced approaches to product development, services, business models, corporate operations, and management from these leading international firms, Chinese businesses continuously improved their technological capabilities and market competitiveness. As the competitiveness of Chinese businesses strengthened, China's dependence on foreign technology gradually declined.
IV. Heterogeneity of U.S.-China Decoupling Across Different Technology Fields
The extent and dynamics of U.S.-China technology decoupling vary across different technology fields. Figure 5 focuses on ten high-tech fields: pharmaceuticals, internal combustion engines, autonomous vehicles, drones, semiconductors, smartphones, neural networks, machine learning, software, and cloud computing. The horizontal axis in Figure 5 measures the degree of technology decoupling, while the vertical axis represents China’s relative dependence on U.S. technology.
The results in Figure 5 illustrate the heterogeneity of U.S.-China technology decoupling and dependence across two dimensions. In mature technology fields, such as internal combustion engine technology, the degree of decoupling between China and the U.S. is relatively low, while China’s dependence on U.S. technology is relatively high. In emerging technology fields, such as drone technology, the degree of decoupling is relatively high, while China’s dependence on U.S. technology is relatively low.
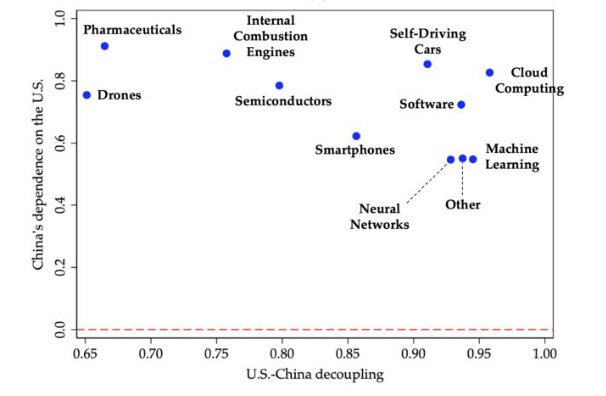
Figure 5. Decoupling and Dependence, 10 High-Tech Fields
Figure 6 further explores changes in the heterogeneity of U.S.-China decoupling. In both the left and right panels of Figure 6, the horizontal axis measures the degree of technology decoupling, while the vertical axis represents China’s relative dependence on U.S. technology. The left panel shows the measures of decoupling and dependence in 2015, while the right panel represents these measures in 2021. The results in Figure 6 reveal two major trends in recent years. First, most data points have shifted to the right, indicating that the degree of U.S.-China technology decoupling has intensified in these high-tech fields. Second, most data points have shifted downward, indicating that China’s dependence on U.S. technology has decreased in these high-tech fields. Notably, in some fields, such as drone technology, the measure of China’s dependence on U.S. technology has even turned negative, meaning that in these fields, the U.S. now depends more on Chinese technology than China does on U.S. technology. This reverse dominance can be attributed to the rapid advancements in the technical capabilities and market competitiveness of Chinese enterprises in these areas, such as DJI in the drone industry.
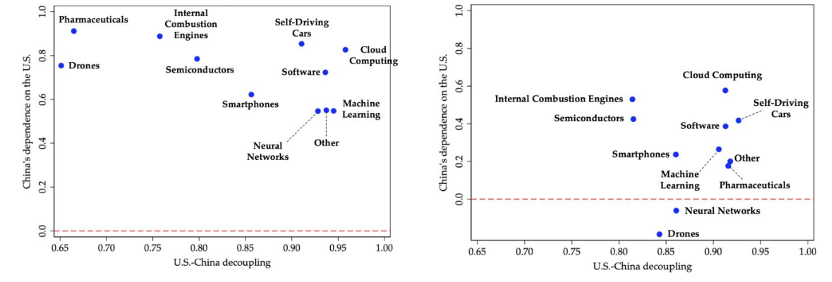
Figure 6. Decoupling and Dependence in 2015 (left) vs. 2021 (right), 10 High-Tech Fields
V. Conclusion and Policy Recommendations
To comprehensively and accurately assess the technological relations between China and the U.S., it is essential to distinguish between the concepts of "decoupling" and "dependence" in the technology sector. Technology "decoupling" refers to the incompatibility of technological development paradigms between different technological systems due to varying technical standards, which is not necessarily related to a country's technological strength. In contrast, the concept of "dependence" is closely related to a country's technological strength: the weaker a country's technological strength, the higher its dependence on foreign technology. In the 21st century, the dynamics of U.S.-China technology "decoupling" and "dependence" have followed different trajectories. Since China's accession to the WTO, the overall measure of decoupling between the two countries has gradually declined, while China's dependence on U.S. technology has exhibited an inverted U-shaped trend (i.e., first increasing and then decreasing), with the turning point being the end of the global economic recession.
The degree of technology decoupling and dependence between China and the U.S. varies significantly across different technology fields. In mature fields, such as internal combustion engine technology, the degree of decoupling between China and the U.S. is relatively low, while China's dependence on U.S. technology is relatively high. In emerging fields, such as drone technology, the degree of decoupling is relatively high, while China's dependence on U.S. technology is relatively low. In high-tech sectors, the degree of U.S.-China technology decoupling has intensified in recent years, while China's dependence on U.S. technology has decreased. Notably, in some fields, such as drone technology, China has achieved reverse dominance, where the U.S. now depends more on Chinese technology than China does on U.S. technology.
Given the heterogeneity in the degree of technology decoupling and dependence across different fields, China's industrial policy should be tailored to each specific technological area rather than adopting a one-size-fits-all approach. Specifically, policies should be differentiated based on the characteristics of emerging and mature technology fields to maximize their effectiveness.
* Originally published as: Han, Jiang and Mei, 2024. Mapping U.S.–China Technology Decoupling: Policies, Innovation, and Firm Performance. Management Science.
[1] Dr Pengfei Han is an Associate Professor of Finance at the Guanghua School of Management, Peking University.
[2] In purchasing power parity (PPP) measures.